It’s not a reason for crashing but still many of your cameras are constantly in timeout (and therefore not working). Is there a reason for this ?
Yeah, I’m aware of that, one of our locations had an outage. It’s fixed now.
No crash since the upgrade, btw!
Well since I didn’t fix anything which seemed suspect in this regard, I wouldn’t celebrate too quickly.
Once it will work for a week non-stop (which previous versions could do without issues) on your system then I’ll be satisfied.
Maybe there’s really something related to sources timing out in loop, usually on my test system i have only “online” cameras and didn’t test intensively how it behaves if it tries to connect every 5 seconds in loop for several hours / days. I’ll setup 1-2 unexisting sources on my test server to simulate this situation…
Yeah, I have cameras from 3 different locations. They’re also in pretty bad conditions, so sometimes we lose internet connectivity. Of course, no software can connect to a disconnected camera, but I’d like to make sure it doesn’t crash when that happens. 
Hi,
camera 2 was an Axis camera. But I am not 100% sure if I used the template or custom URL.
It looks like the issue is still there, even with NetcamstudioX (both 1.5.1 and 1.5.2). After the service refused to start 4 days ago, I started up up X again. It ran without issues from 6/5 7:22 until 8/5 19:09, where it crashed with the following in the log:
Information 19:08:21.237 Source(11).StopRecording File recording completed for Recording_11_20170508_190808_503.mp4 (00:00:12.7186425). Took 94 ms 2254 1215,58MB
Error 19:08:26.269 WebServer.RootVideo Exception in MoonwareServer. Command:http://beomcamsurv01:8100/jpeg/0?resolution=0 from 10.101.50.112
Exception Detail:De objectverwijzing is niet op een exemplaar van een object ingesteld. 2225 1268,50MB
Warning 19:08:26.269 WebServer.ServerRequest Failed Request for http://beomcamsurv01:8100/Jpeg/0?resolution=0 from 10.101.50.112.
HTTP Error 500 - Internal Server Error 2226 1268,50MB
Information 19:08:28.066 Source(0).StartRecording Started File Recording [MotionDetector]. Took 16 ms 2238 1317,58MB
Information 19:08:39.253 Source(0).StopRecording File recording completed for Recording_0_20170508_190828_050.mp4 (00:00:11.1875128). Took 78 ms 2231 1264,26MB
Information 19:08:46.428 Source(5).StopRecording File recording completed for Recording_5_20170508_190805_972.mp4 (00:00:40.4402822). Took 125 ms 2228 1274,93MB
Information 19:08:48.584 LibraryManager Deleted 16 items from local library (Retention expired took 86ms, Library size limit took 5776ms).
Deleted entry 201704192402 from Library
Deleted entry 201704192406 from Library
Deleted entry 201704192403 from Library
Deleted entry 201704192405 from Library
Deleted entry 201704192404 from Library
Deleted entry 201704192408 from Library
Deleted entry 201704192407 from Library
Deleted entry 201704192409 from Library
Deleted entry 201704192410 from Library
Deleted entry 201704192411 from Library
Deleted entry 201704192415 from Library
Deleted entry 201704192412 from Library
Deleted entry 201704192413 from Library
Deleted entry 201704192414 from Library
Deleted entry 201704192416 from Library
Deleted entry 201704192419 from Library
2223 1272,75MB
Information 19:08:53.537 Source(5).StartRecording Started File Recording [MotionDetector]. Took 31 ms 2218 1271,89MB
Information 19:09:07.881 Source(5).StopRecording File recording completed for Recording_5_20170508_190853_506.mp4 (00:00:14.3594050). Took 62 ms 2233 1209,20MB
Information 19:09:09.084 Source(5).StartRecording Started File Recording [MotionDetector]. Took 15 ms 2235 1235,80MB
Information 19:09:26.865 Source(11).StartRecording Started File Recording [MotionDetector]. Took 0 ms 2231 1213,14MB
Information 19:09:28.662 Source(10).StartRecording Started File Recording [MotionDetector]. Took 62 ms 2244 1217,45MB
Information 19:09:33.490 Source(5).StopRecording File recording completed for Recording_5_20170508_190909_068.mp4 (00:00:24.4063093). Took 31 ms 2249 1141,00MB
Information 19:09:42.381 Source(5).StartRecording Started File R
Yesterday evening, I updated to 1.5.2, and started X again at 9/5 20:07. Less then 6 hours later (10/5 02:02) it crashed again with:
Information 01:19:30.022 LibraryManager Deleted 1 items from local library (Retention expired took 75ms, Library size limit took 836ms).
Deleted entry 201704192602 from Library
1850 1206,76MB
Information 01:19:58.491 Source(3).StartRecording Started File Recording [MotionDetector]. Took 16 ms 1858 1207,08MB
Information 01:20:09.054 Source(3).StopRecording File recording completed for Recording_3_20170510_011958_475.mp4 (00:00:10.5781416). Took 46 ms 1854 1242,37MB
Information 01:36:22.157 Source(0).StartRecording Started File Recording [MotionDetector]. Took 0 ms 1829 1201,52MB
Error 01:36:26.032 NetcamVideoSource(4).WorkerThreadMJPEG HTTP MJPEG Thread Buffer is undersized… 1840 1237,58MB
Information 01:36:32.235 Source(0).StopRecording File recording completed for Recording_0_20170510_013622_157.mp4 (00:00:10.0781384). Took 78 ms 1836 1305,47MB
Information 01:55:38.379 Source(3).StartRecording Started File Recording [MotionDetector]. Took 15 ms 1847 1201,04MB
Information 01:56:15.457 Source(3).StopRecording File recording completed for Recording_3_20170510_015538_363.mp4 (00:00:37.0780787). Took 62 ms 1856 1208,88MB
Information 01:56:17.879 Source(3).StartRecording Started File Recording [MotionDetector]. Took 15 ms 1865 1218,34MB
Information 01:56:43.332 Source(3).StopRecording File recording completed for Recording_3_20170510_015617_864.mp4 (00:00:25.4375441). Took 47 ms 1854 1198,80MB
Information 02:00:01.676 Source(3).StartRecording Started File Recording [MotionDetector]. Took 16 ms 1850 1315,81MB
Information 02:00:11.770 Source(3).StopRecording File recording completed for Recording_3_20170510_020001_661.mp4 (00:00:10.0312654). Took 47 ms 1835 1234,86MB
Information 02:01:02.568 ConnectedUser.RefreshUsers Removed 1 User(s) from Active Sessions due to inactivity 1817 1335,66MB
Information 02:02:49.268 ConnectedUser.RefreshUsers Removed 1 User(s) from Active Sessions due to inactivity 1729 1198,70MB
Information 02:02:49.613 NetcamVideoSource(11).PlayingFinished Stream Event received [DeviceLost] 1730 1191,77MB
Information 02:02:49.754 NetcamVideoSource(8).PlayingFinished Stream Event received [DeviceLost] 1727 1218,04MB
Information 02:02:49.863 NetcamVideoSource(7).PlayingFinished Stream Event received [DeviceLost] 1724 1223,24MB
Warning 02:02:51.566 NetcamVid
The funny thing is that right now, while it is crashed, the console log is still displaying recent data, but always the same line:
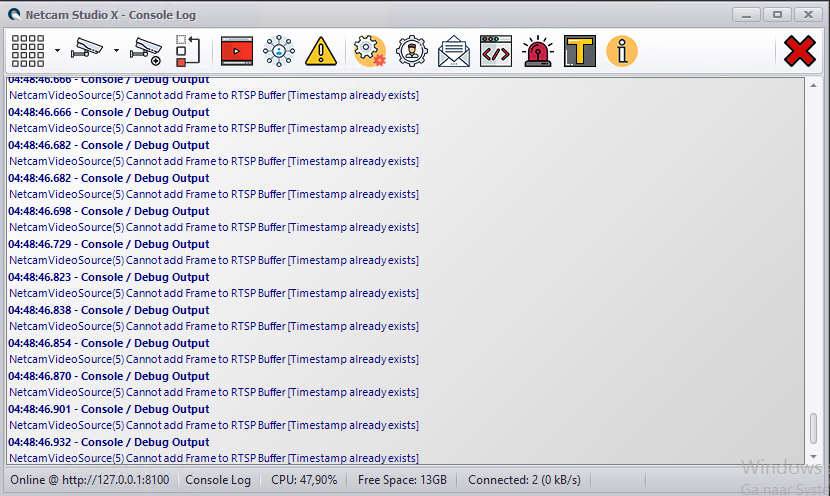
So you can still see the console log refreshing every 1 or 2 minutes (but only the times get updated). But the window itself is not responsive anymore.
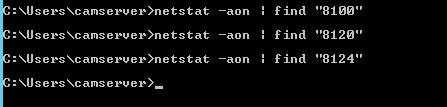
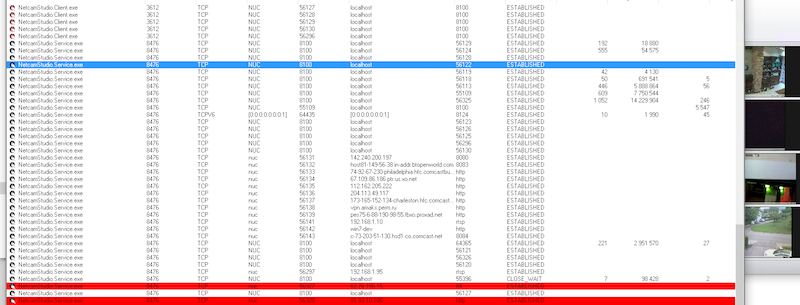
So actually it’s not completely crashed, but went brain dead again. When connection to the webinterface at http://10.101.4.2:8100/, it just keeps loading forever. It doesn’t timeout immediately, which indicates that port 8100 is still held open by NCS, which is also confirmed by netstat:
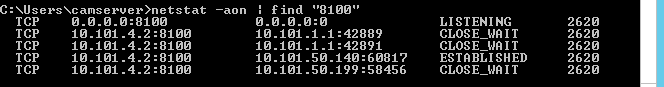
same for 8120 & 8124:
![]()
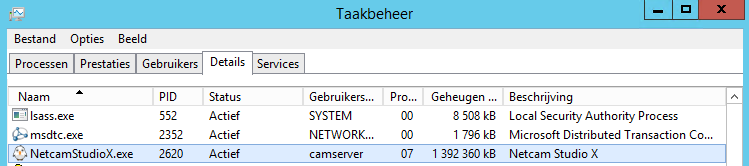
The memory and CPU usage is relative low, but still going up and down a bit:
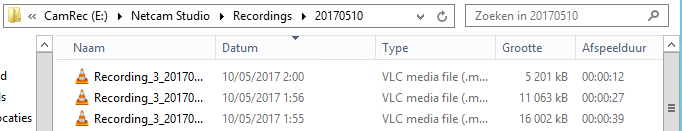
But to be clear, nothing has been written to the log file, or to the repository since 2:02:
Now I killed X using task manager, and I can see that the listening ports go away:
I started X again, and now everything is running again.
I’ll send you the logs in PM.
Hello Mitch,
You’re running 64-bit version right ?
Because in term of memory the process is at 1.2-1.3GB so that’s the maximum a 32-bit process can be (and that’s a lot even for 64-bit process). I’ll check the logs to see what I find.
Hi Steve,
Yes, I run the 64 bit version.
ok there are 2 things I just need you to explain so that I can try to reproduce / simulate similar scenarios.
1 account / user is connecting very regularly to ncs, what is this for ? do you have another ncs consuming or retrieving images from it ?
I also see some errors: HTTP MJPEG Thread Buffer is undersized…
Do you have a camera connecting in MJPEG mode that provides very high resolution ? (and returns images > 2MB) ?
Can you please here send a capture of one of these? Your 5th camera (internal sourceid 4)
Can you also please post 3 screenshots of the performance monitor view (from web client) for the last 3 days ?
Thanks
Hi Steve,
1 account / user is connecting very regularly to ncs, what is this for ? do you have another ncs consuming or retrieving images from it ?
Client 10.101.1.2 is the probe of our monitoring system. It checks if the web interface still works (to detect NCS outages)
Do you have a camera connecting in MJPEG mode that provides very high resolution ? (and returns images > 2MB) ?
Following cams are connecting in MJPEG mode:
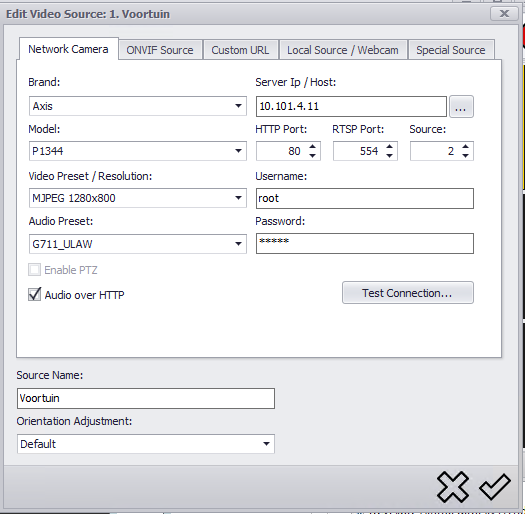
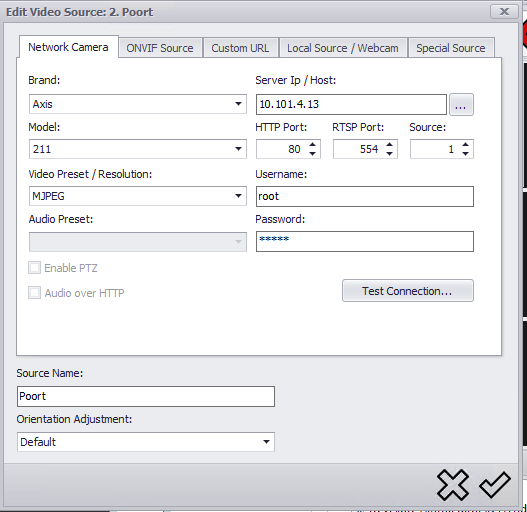
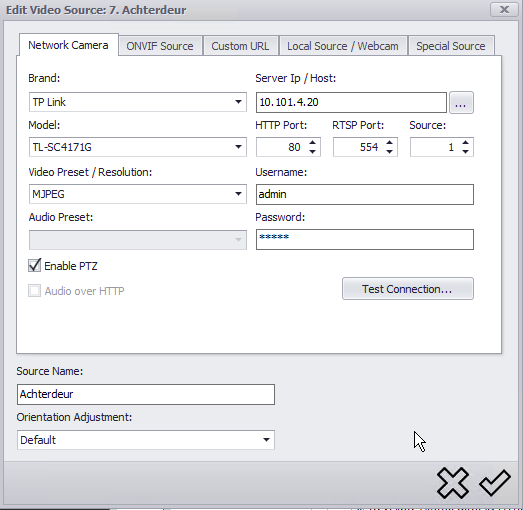
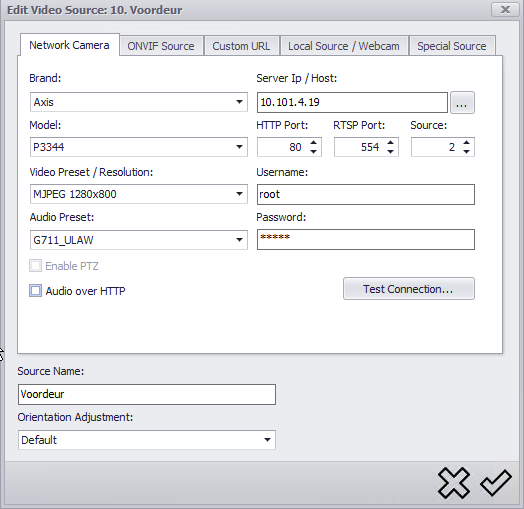
Do you want me to check for those the sizes? (How? :)). The rest is using RTSP
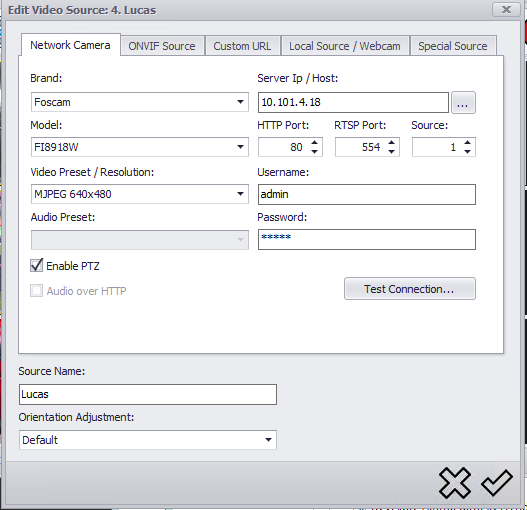
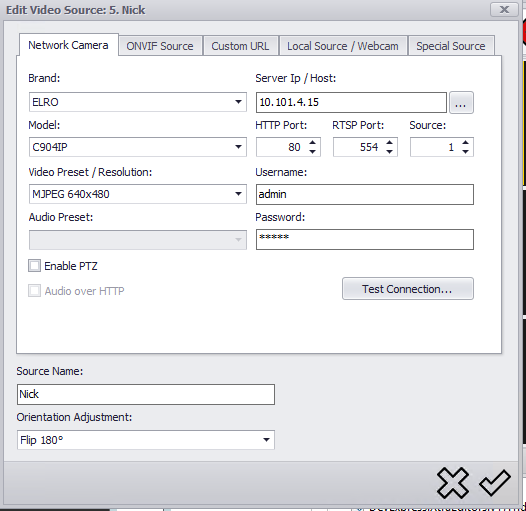
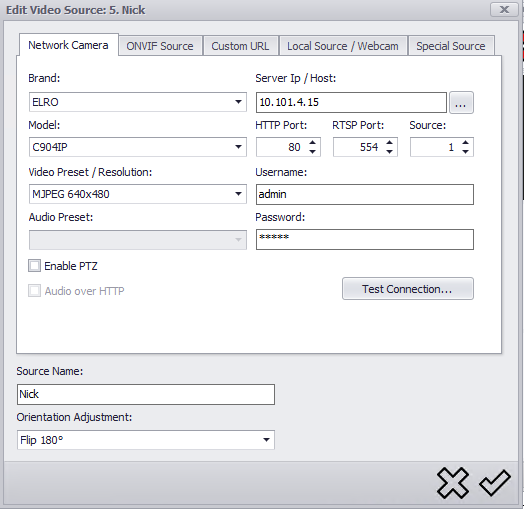
Can you please here send a capture of one of these? Your 5th camera (internal sourceid 4)
Here the settings for cam 5:
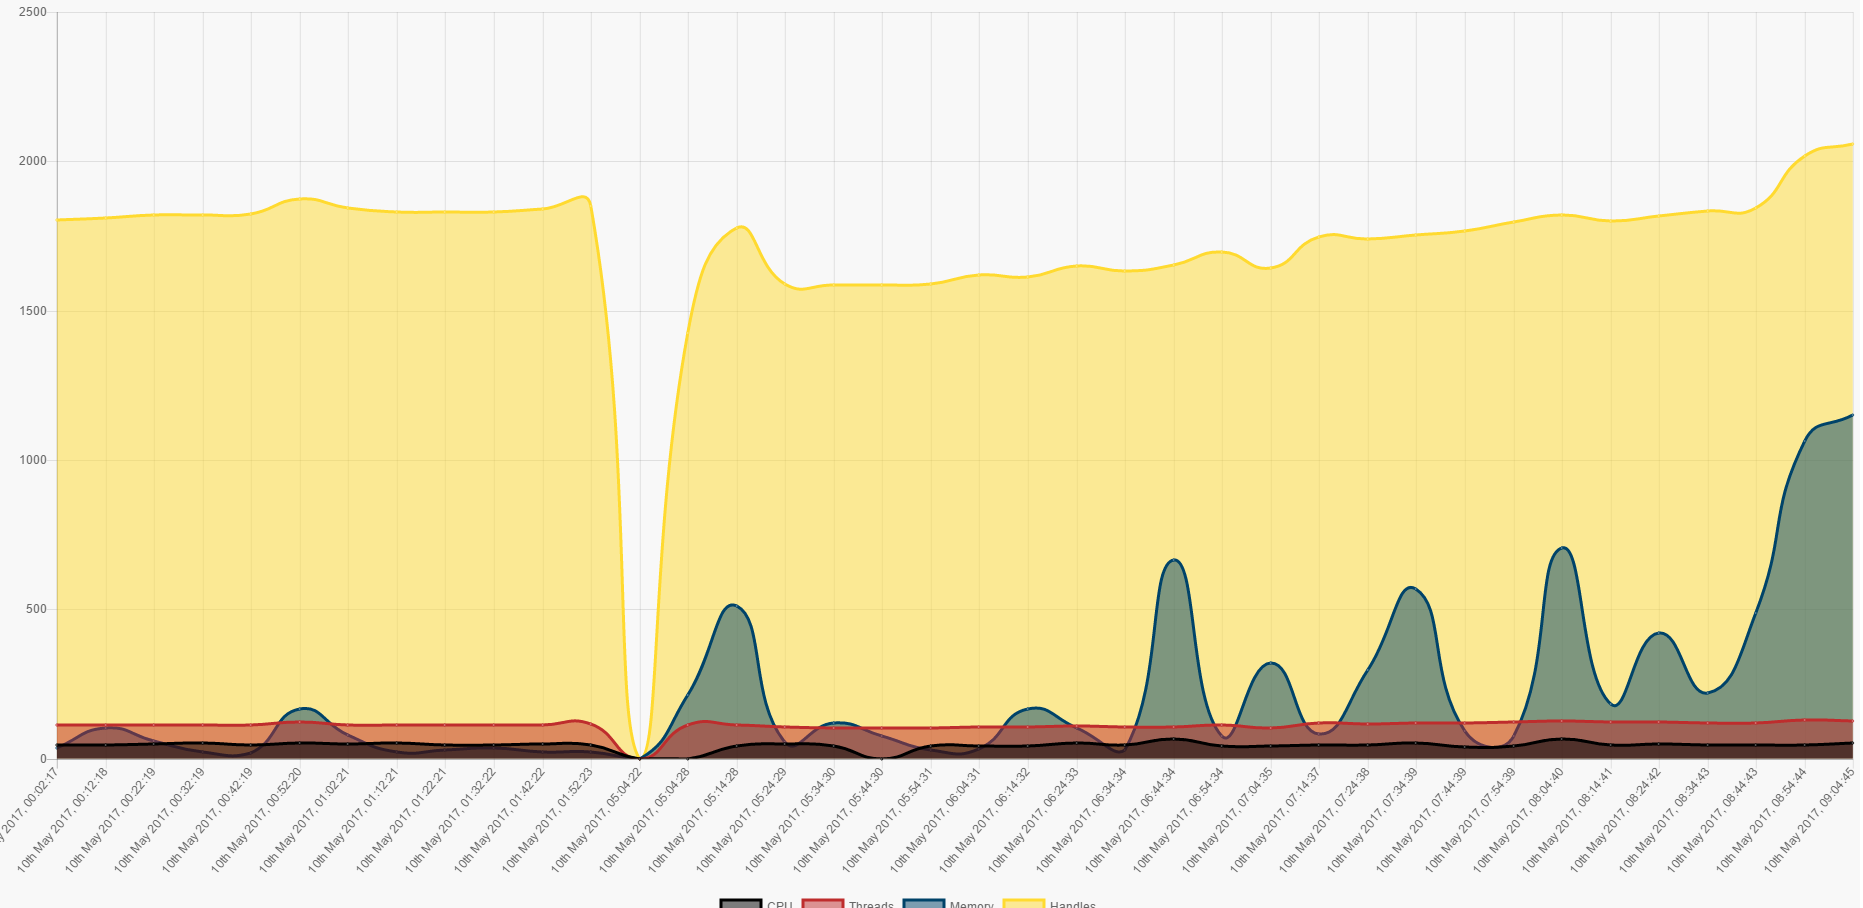
Can you also please post 3 screenshots of the performance monitor view (from web client) for the last 3 days ?
10/5:
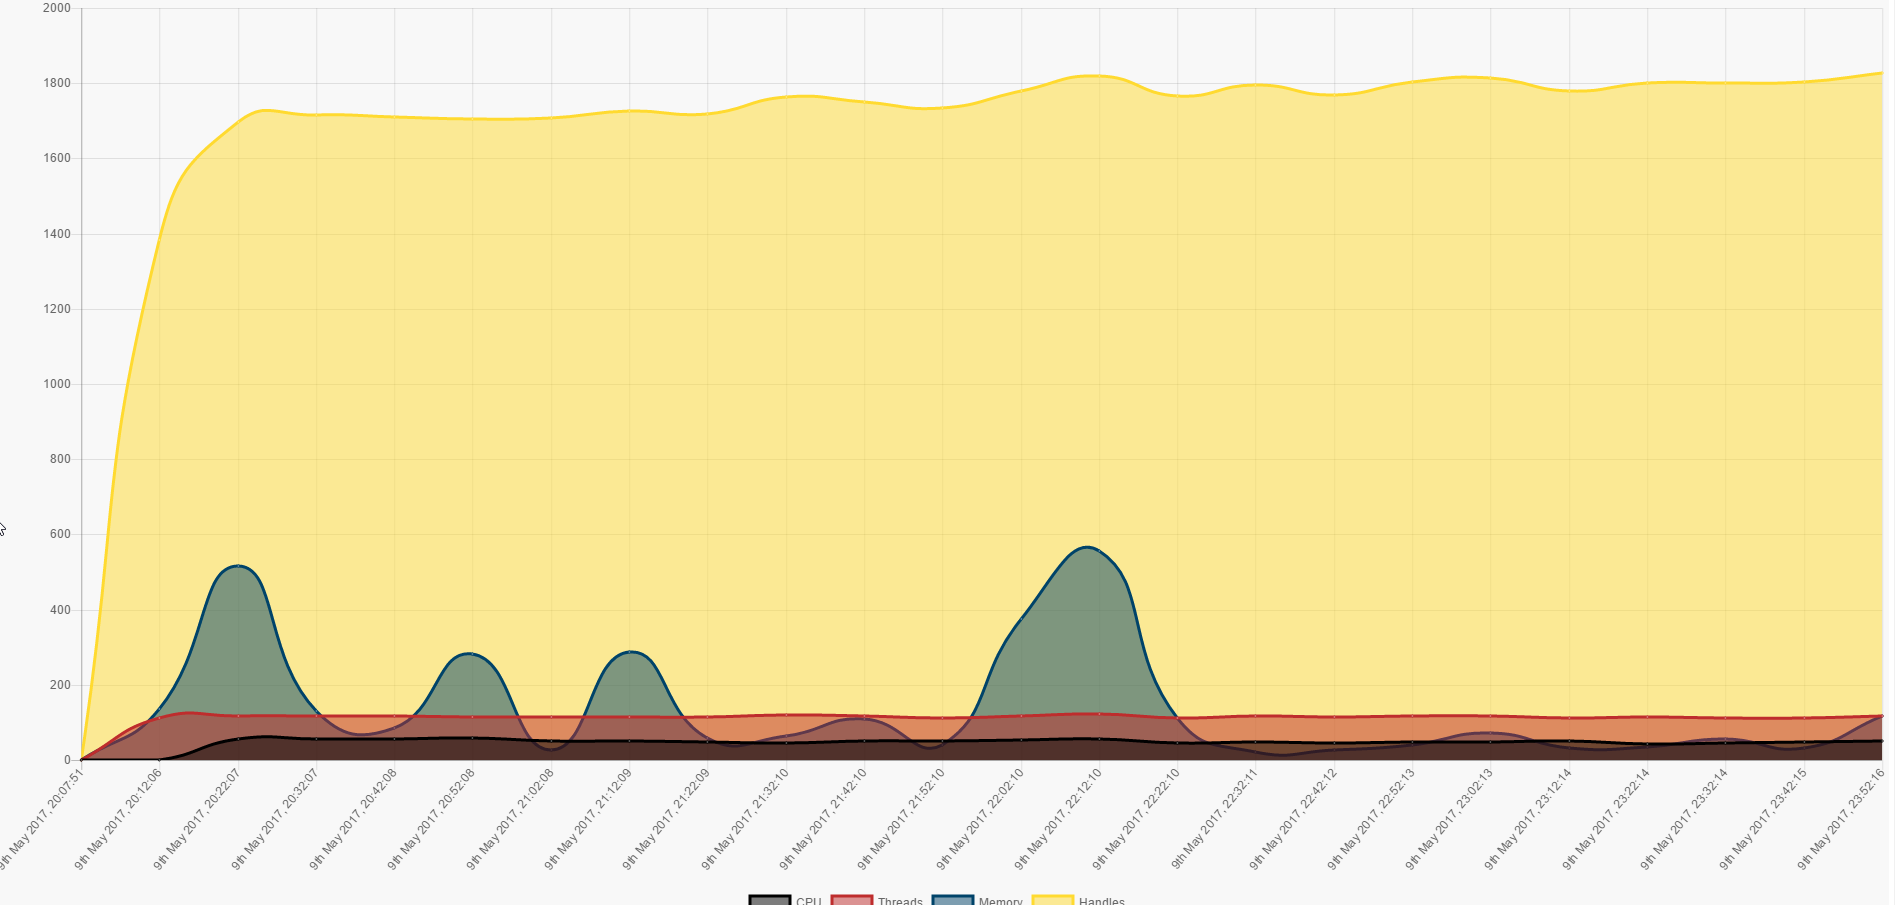
9/5:
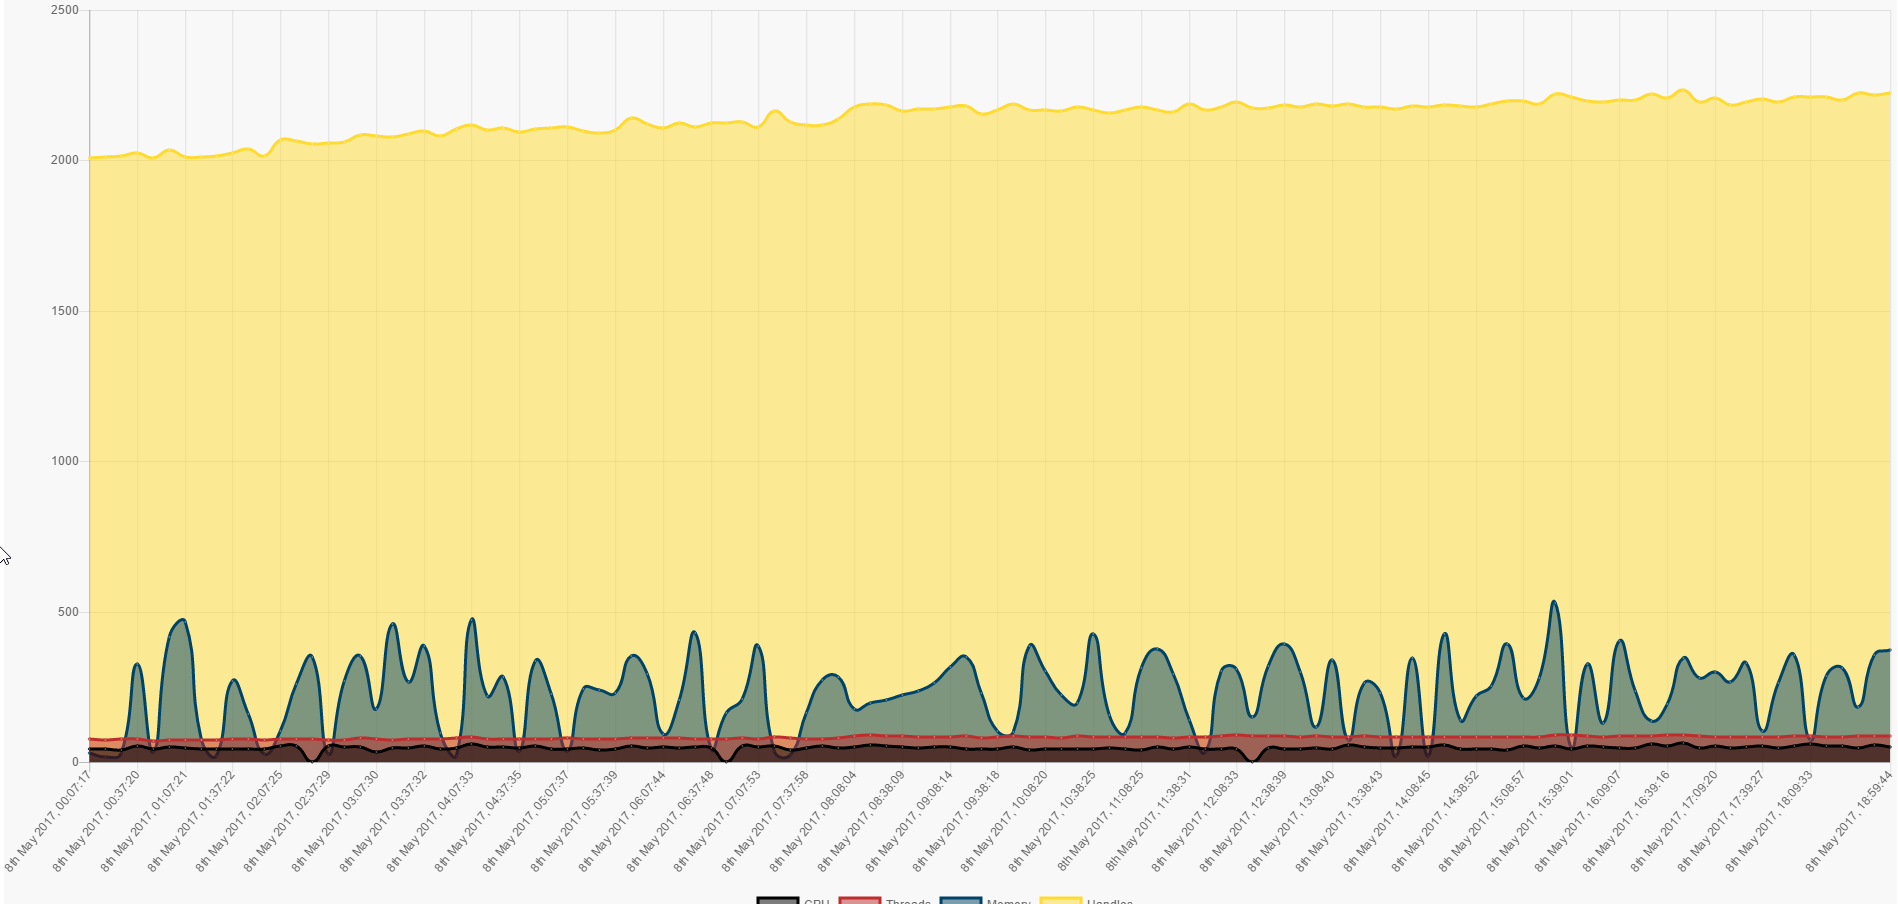
8/5:
Just happened to me for the first time. As it doesn’t crash I don’t have the exact location / source of the problem but it’s giving some clues already. I will keep it running in this state for now so that I can investigate.
1 Like
Hasn’t happened to me since the upgrade to 1.5.2.
However, I did disabled some cameras that where having timeout issues, then got quicker internet at that location.
Don’t know if that info helps or not, but I figured I’d pass it on.
Seems related to ffmpeg when recording (since the new upgrade to ffmpeg 3.3) but apparently occuring very rarely.
Ok, I made some progress here. I have managed to reproduce similar situation twice here. First time I couldn’t investigate because it was the production build and it cannot be debugged.
Actually I figured out what what happening here but I’m not sure that it’s the same in your case. The software is actually not really frozen or crashed but just saturated of http connections and refusing to accept new ones.
In my case it’s because another system (another NCS) was retrieving live stream / the mpeg 4 stream while cpu was already intensive. Had some timeouts and the host was in loop requesting new connections until it reached the critical status where ncs would not accept opening new ones.
So I suppose it’s not your case and you don’t have an external system retrieving the MPEG4 streams from netcam studio. While debugging the process was paused and this allowed all connection to expires (and nothing to create new ones during this time), after resuming the app it was again working as before.
If you have the problem again, please take a screenshot of all connection made to Netcam Studio (using TCPView) so that we can check which connection may be the cause on your end.
Hi Steve,
thanks for the info & investigation!
If it crashes again, I’ll launch TCP view and provide a screenshot.
Ok, i found it.
Not related to any of my suspicion (well http flooding can occur but not the root cause here as it’s not stuck forever)
There is a risk of dead lock between the event logging and the performance counters thread. Looking forward to fix ASAP.
2 Likes
here’s you go:
I’m confident that this version will solve that one for good.
It was related to the Performance monitor (so something new introduced in 1.4.x) and I was really luck to figure out because such deadlock issues can be really complicated to diagnose and understand.
Thanks Steve,
Will upgrade ASAP.
Thanks Steve!
I upgraded the server. Let’s see how it goes.
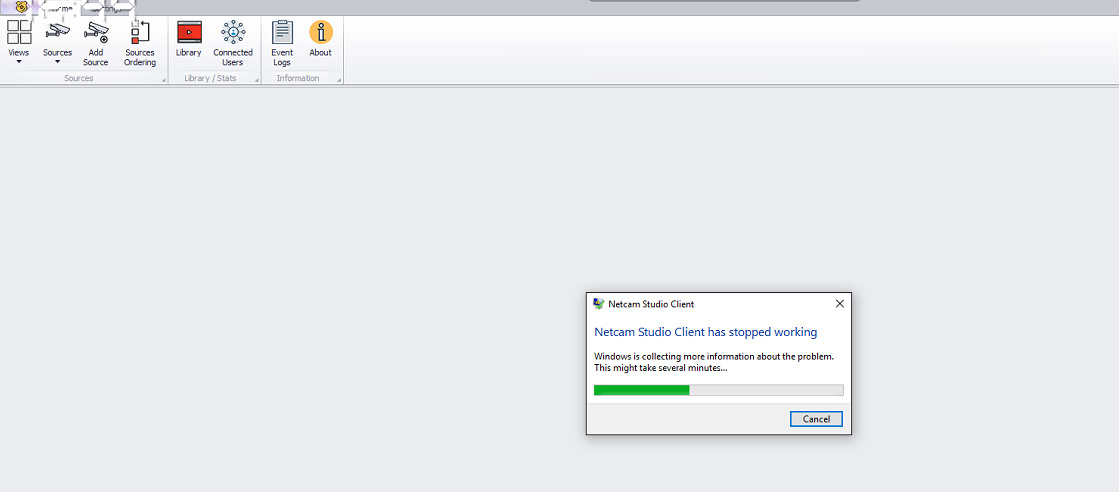
I also upgraded 1 standalone client from 1.5.1 to 1.5.3. However, I can’t start it anymore now, it just keeps crashing:
I tried removing the config file to get it recreated, but then I get a ‘configuration failed to initialize’’ (so placed it back)
1 Like
Two things. 151 was a little bit special. After exit check that no NCS process is running. Start 154 client again. I tested and I think it needs it server to work.