I don’t know, but you have to check Some suggestions:
-restart the VM,
-turn off motion detection for each camera and see what’s happening with the cpu load,
-disable each camera,
-it can be a camera that behaves strange,
-stop the service and run NCS X,
-…
It seems that it’s a problem with the motion detection. I disabled the 4 cameras that have motion detection enabled, and now NetcamStudio is just flying. (They are analog cameras connected to two Axis 2400+ servers). I have other cameras using Axis 2400+ connected but without motion detection enabled.
So that’s something. But what should I do? I’d like to keep motion detection enabled on those 4 cameras and it was working fine until it suddenly wasn’t.
I’ve now disabled motion detection, but enabled all cameras. I’ll see how it goes…
EDIT: Okay, it’s pretty clear it’s the motion detection. The server is idling, with 0-2% usage. But what I have noticed when I change sources using the Netcam Studio client (running on another machine) is that it takes a pretty long time to switch from one camera to another.
Could this be it?
When I switch cameras using the web interface it’s much faster.
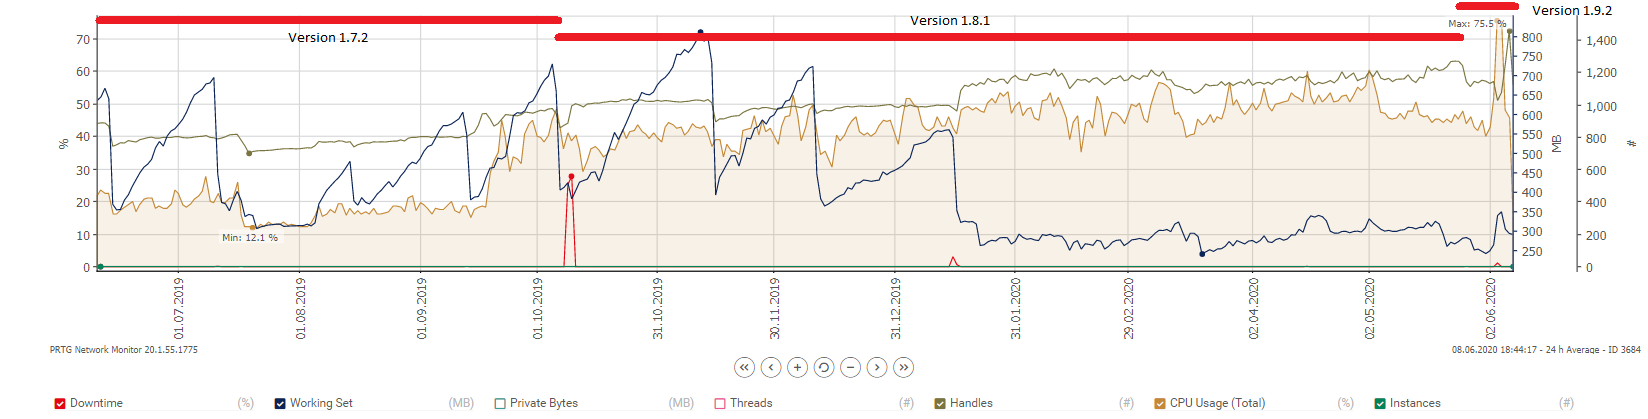
It should also be noted that I upgraded to the lastest version on May 26th, because I thought Netcam Studio was using more CPU than it should. After the upgrade, the CPU usage sank to acceptable levels, but then suddenly skyrocketed to almost 100%…
Hi,
There are mainly three parameters from the cameras that affect the cpu load that much; resolution, frames per second and bitrate. Resolution and fps can be controlled in the UI where you add the camera or in the configuration in the camera. The bitrate from the camera can only be controlled in the camera configuration. However, you can read the bitrate in the Task Manager and Performance tab. Click on Ethernet and you can see the bitrate Received to the computer. This is the total from all cameras so you need to disable them all and enable one at the time. A bitrate of about 6 Mbps per camera is usually a good value. Check these three parameters if something have changed from earlier.
You are correct about that the web client use much less cpu load than the windows client. The web client use the built in web server in NCS and the HTML 5 format which is very efficient and use less cpu load.In the windows client there are many other things going on as well which use cpu resources.
The weird thing is that if I disable the third camera, the CPU usage stays high until I disable yet another camera.
Here’s the CPU usage (for the process) for motion detection on my system:
Zero cams: 0-2%
One cam: 3-5%
Two cams: 10-15%
Three cams: 70-75%
More…: 99-100%
It seems that the CPU might stay high until I disable all cameras. A restart of the services might even be required.
This seems very weird to me.
Just for the sake of testing: Is it possible to downgrade to a previous version and see if it behaves the same without losing any settings?
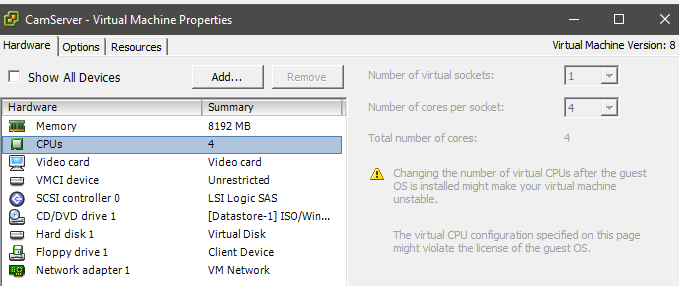
Is there anything else I might be missing? Some magic setting somewhere? I’m running on Win 10 1909 on a VM on ESXi using a Xeon processor. A Fujitsu TX150.
The jump between 2 and 3 cams, is it always for the same camera or is it like that in general?
In my posting above I discussed resolution, fps and bitrate. Have you checked that from the cameras?
In the setup of Win10 in ESXi you can select the number of cores to be used for the VM. Can that have been changed?
I assume the diagrams above are from the the ESXi. If you check the Task Manager in Win10 does that behave in the same way.
Can you install NCS on another computer and add 3-4 cameras and see how that goes? Or setup a new VM with Win10 and install NCS and see how that VM reacts.
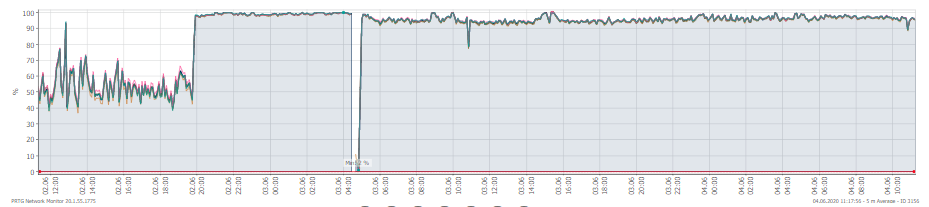
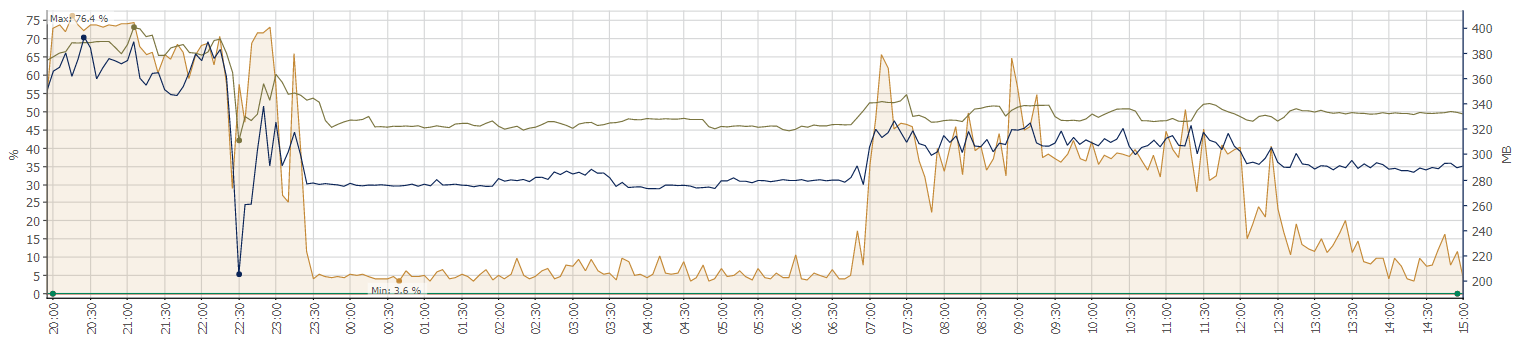
I’m a little lost. Last night I went through all cameras, just to see if settings were changed. Now all cameras are set to “FrameDifference” and no marking. At 23:00 it looked well. Only one camera with motion detection enabled,
So around 12:00 I checked again and noticed the spike at 07:00. I have not changed ANY settings. At 12:00 I opened the web interface, changed sources a couple of times, and then closed the web interface. That’s it.
I don’t know why, but as we can see the CPU usage dropped again.
The data is from PRTG, running on a different server.
The data is measured of the actual process, which I think is the most accurate in this situation. It’s the same that is shown in Task Manager, but with the option for logging.
I’m beginning to believe this has something to do with streaming multiple cameras at the same time. With only one camera stream and one motion capture, the CPU usage is low. If I show more than one camera at the same time, the CPU usage climbs. If I enable motion detection to more than one source, the CPU usage climbs.
As far as I can tell it doesn’t matter which of the sources I choose, even if they vary alot of image size, framerate and bitrate.
Everything is OK there. But 4 cores is really not that much considering the amount of cams. Actually on one of my systems I have a 4 core Xeon e3-1220 v3 running ESXi. On top of that I run Win server 2008R2 and the NCS as a service. There are 20 cams in mo.det. CPU load is 95-100%. Cameras are mainly 640x480 and some 720p and a couple 960p. The cpu is definitely overloaded, but it has been working with no problems for 6 years with no crashes. Downtime is only when I do maintenance.
From the text above I get the impression that you run either NCS service and win client or NCS X on the same computer. Mo. det. will use cpu load and if you look at the video from all cams on the same system that will definitely consume cpu due to the rendering to the GUI.
So I recommend to run NCS as a service on the VM and then use another computer with the NCS Win client for configuration and then the web client.
Yeah, that’s my experience with Netcam Studio too, except I had lower CPU usage and only 4-5 camperas with mo.det. Netcam Studio has been working wonders, up until this or the previous version.
I have a “dedicated” VM for Netcam Studio. I run the client on a different machine. I seldom use either clients, most of the time I grab images from NS using the URLs from the API (using HStouch for HomeSeer). And then I usually limit the framerates to 2-4 FPS.
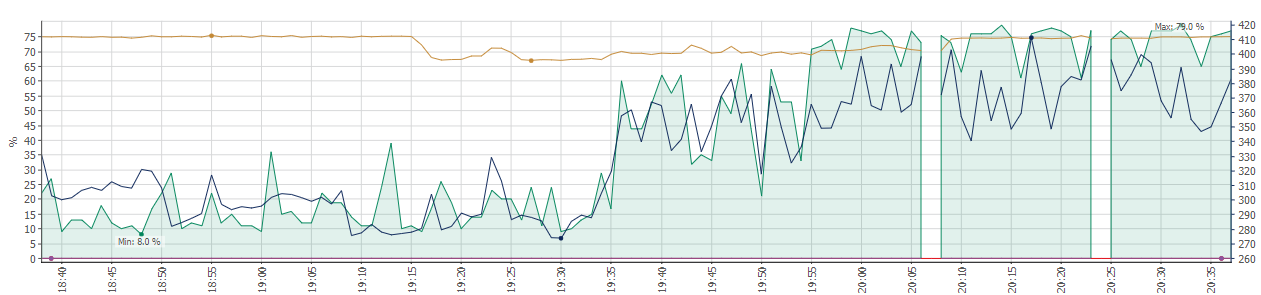
But a new test: Two cameras with mot.det: 15% during the last two hours.
I’ve just enabled a third camera. We’ll see how it goes.
I think that I did change some simple mot.det settings in september last year, but I can’t really be sure now.
Is it possible to downgrade?
I tried running the installer, but it won’t run as I have a newer version installed.
If I uninstall, will all my settings remain?
If you have a license you can run any version. You must uninstall the new version first. Be careful when downgrade since a lot have changed especially to version 1.9.1. Might be better to do a clean install an then install the older version.
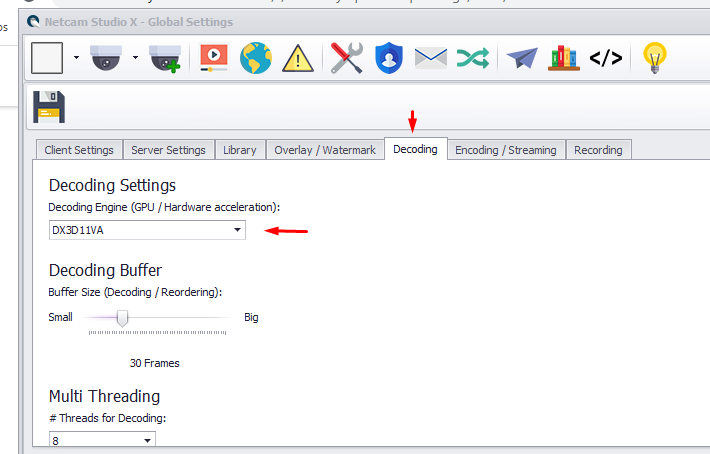
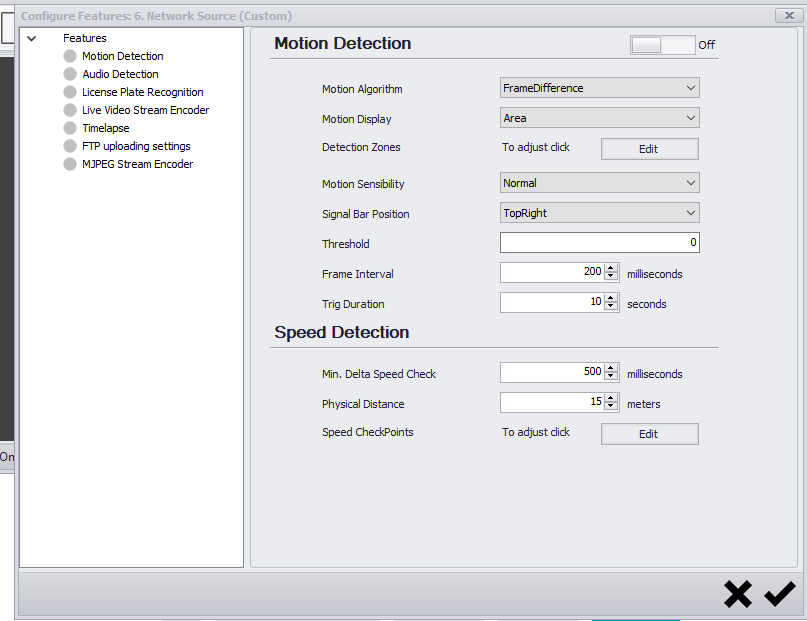
Default settings for motion detection